Movie of the 2011 Japan earthquake and its aftershocks
On March 11, 2011 a magnitude 9 earthquake occurred off the coast of Japan, generating a massive tsunami that caused major damage to infrastructure and loss of life. The magnitude 9 earthquake was followed by thousands of smaller earthquakes known as aftershocks in the hours after the earthquake. The magnitude of aftershocks is known to decreases exponentially after the main shock and can be seen in the data set, as shown in Figure 1.
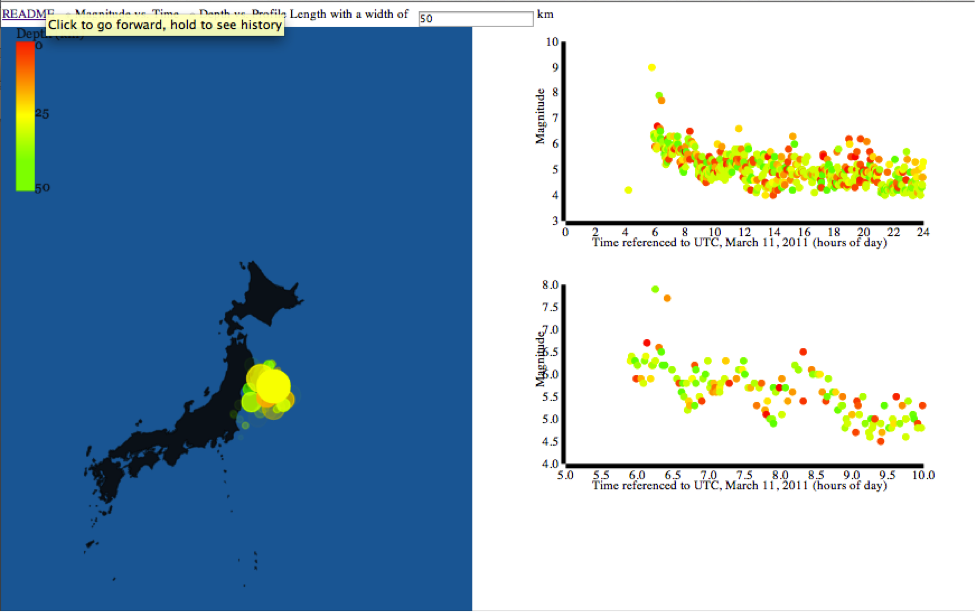
Figure 1. Screen shot of the earthquake movie . The map on the left plots earthquakes at the end of March 11, 2011. Circles are sized by magnitude and colored by depth in kilometers. The plots on the right show the earthquake magnitudes plotted over time, colored by depth. The top figure spans the entire day, where as the lower figure shows a zoomed-in view of the 5th through the 10th hour of the day.
Interestingly, the earthquake magnitudes fluctuate over time. Omi et al. [2013] note this behavior and model it in their paper "Forecasting large aftershocks within one day after the main shock".
Using earthquake data provided by the ANSS database, Ville Juutilainen, Gayane Petrosyan, Sean Mathew Lawrence and I worked on the Japan Earthquake Movie. It allows the user to choose the plot they want to see while the movie plays. The first default is the plot shown above that displays Magnitude vs. Time. The other shows Depth vs. Profile Length. The Depth vs. Profile length option allows the user to select two points to define a profile. Points within a certain distance defined by the user are plotted on the map and on the plot. The user must select two points to see the plot. The code is written in Javascript, taking advantage of the D3 framework. You can access the code in my github repo. The code has been tested for Chrome, but has yet to be tested for other browsers.
Comments
comments powered by Disqusblogroll
social